日本語は最後にあります。
Listed in English, Chinese, and Japanese in that order.
Please note that this is an automatic translation.
英文、中文和日文,依次排列。
请注意,这是一个自动翻译,任何错误的翻译都应予以确认。
Familiar Statistics (4)
Recently, I had the opportunity to watch a captivating lecture from the Open University of Japan on the theme, "Capturing Data Variability in Figures." It reminded me of the power of statistics to unravel patterns hidden within numbers.
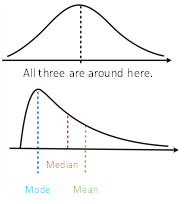
At the heart of data interpretation are representative values. They include the mean, median, and mode. The mean, or average, represents the data's center of gravity but lacks robustness against bias or outliers. Conversely, the median, which represents the mid-point where data is halved, shows resistance to such distortions. The mode, on the other hand, marks the value with the highest frequency.
Another key aspect is data dispersion and shape, including variance, standard deviation, coefficient of variation, skewness, and kurtosis. These factors can reveal if data is symmetrical or asymmetrical, hinting at outliers.
Quartiles (Q1, Q2, Q3) break data into four segments, while the quartile range (Q3-Q1) gives us a sense of data spread. Combining these quartiles with maximum and minimum values gives us a five-number summary, which helps to create informative box plots, a powerful tool for outlier detection.
In essence, these statistical tools are invaluable in our quest to understand the variability and nuances within our data.


熟悉的统计学 (4)
最近,我观看了日本开放大学的一次讲座,主题是 "在数字中捕捉数据的可变性"。讲座的精彩让我对统计学的威力有了更深的认识,它有力地揭示了隐藏在数字中的规律。
在数据解释的核心是代表性的值。这些代表性的值包括平均值、中位数和众数。平均值或者说是均值,代表数据的重心位置,但是对偏差或离群值缺乏稳健性。相反,中位数代表数据的中点,即数据被分为两半的位置,对这种扭曲有较强的鲁棒性。而众数,则标记了频率最高的数据值。
另一个关键方面是数据的离散度和形状,包括方差、标准差、变异系数、偏度和峰度。这些因素可以揭示数据是否对称或非对称,从而暗示出离群值的存在。
四分位数(Q1, Q2, Q3)将数据划分为四个部分,而四分位数范围(Q3-Q1)给我们提供了数据的分布感观。结合这些四分位数和最大最小值,我们得到一个五数总结,这帮助我们创建了内容丰富的箱形图,这是一个强大的离群值检测工具。
总结一下,这些统计工具在我们理解和揭示数据的可变性和微妙之处的探索过程中,价值不可估量。


身近な統計 (4)
私は最近、放送大学の講義を視聴しました。そのテーマは"データのばらつきを数字で捉える"でした。その講義で習った内容をお伝えしたいと思います。
まずは基本統計量、つまりデータの代表値を考えます。代表値とは、多峰のデータを分類したり、データの中心位置を示したり、データのばらつきの大きさを捉えたりします。さらに、データが対称か非対称か、外れ値があるかどうかを考えることも大切です。
ここで重要なのが、平均値、中央値、最頻値の3つの代表値です。平均値はデータの重心の位置を示すものですが、偏りや外れ値に対する耐性(ロバストネス)がありません。一方、中央値はデータを半分に分ける位置を示し、偏りや外れ値に対する耐性があります。最頻値は度数が最も大きいデータ値を示します。
さらに、データのばらつきを詳しく見るためには、分散、標準偏差、変動係数、歪度、尖度といった指標を考えます。また、データを大きさの順に並べて4つに分ける四分位数(Q1, Q2, Q3)、四分位範囲(Q1とQ3の範囲)、最大値、最小値、範囲といった情報も役立ちます。
そして、これらの情報をまとめるのが5数要約(3つの四分位数+最大値+最小値)と呼ばれるものです。5数要約は、データ全体の概要を簡潔に示す方法として広く用いられます。
さらに、5数要約を基にした箱ひげ図は、データの分布と外れ値の有無を視覚的に把握するための強力なツールです。箱ひげ図では、四分位範囲の1.5倍以内の最大値と最小値を使って、データの分布を示します。
以上のように、統計は私たちがデータのばらつきを理解し、有意義な情報を引き出すための重要な道具です。これからも、統計学の魅力を共有していきたいと思います。


office Hana An / 小庵